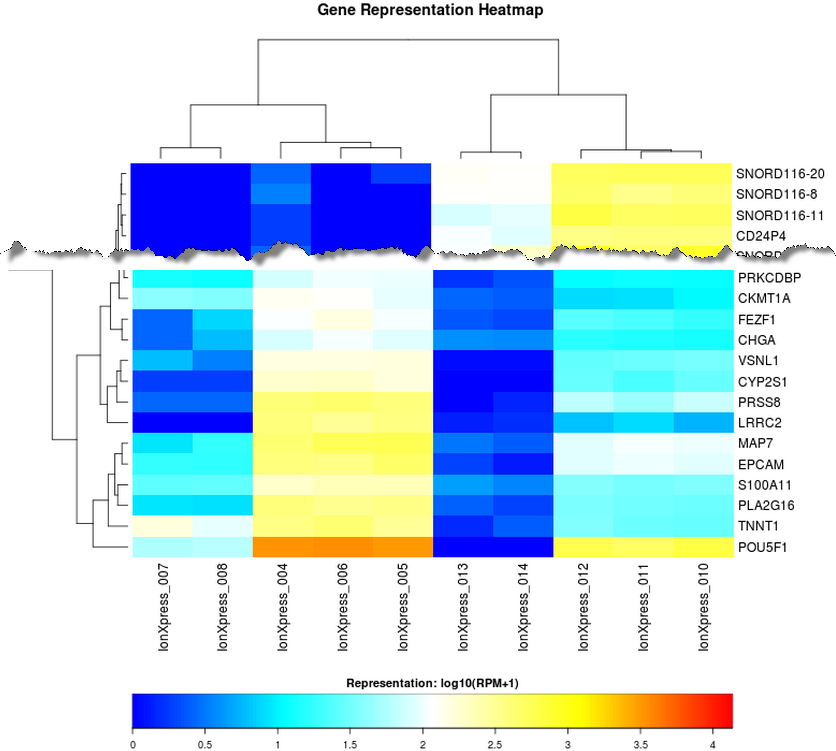
Gene heatmap
The following is a gene representation heatmap of 250 genes showing the most variation in representation across barcodes as measured by the coefficient of variant (CV) of normalized read counts for genes that have at least one barcode with at least 100 RPM reads. The heatmap is plotted using log10 of those counts. For this plot, barcodes are omitted if they have less than 100,000 total reads.