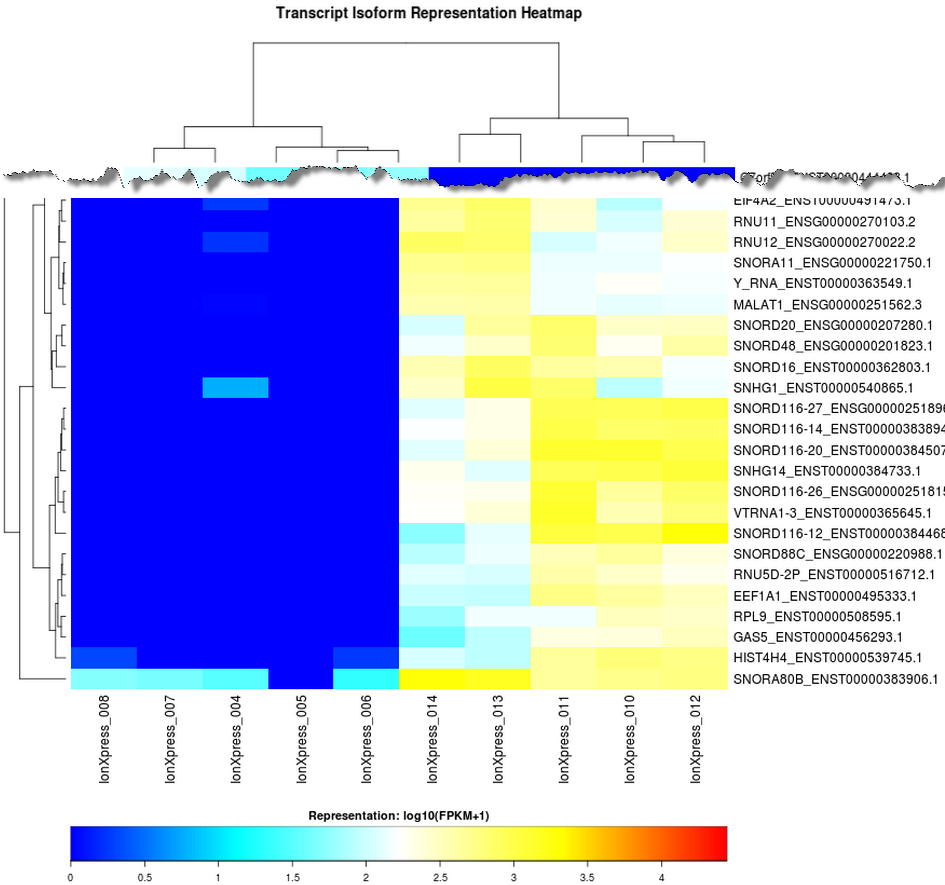
Isoform heatmap
A transcript isoform representation heatmap of up to 250 gene transcript isoforms showing the most variation in representation across barcodes as measured by the coefficient of variation (CV) of FPKM values for isoforms that have an FKPM value ≥ 100 for at least one barcode, plotted using log10 of FKPM+1. Barcodes are excluded if they have less than 1,000 isoforms detected at FPKM values ≥ 0.3.