
Run report metrics before alignment
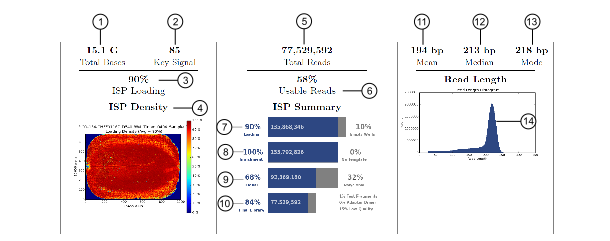
To assess the sequencing run, you can review the quality metrics for the unaligned reads. Primary pipeline processing, basecalling, and signal processing generate these metrics. The following prealignment metrics are provided in the run report. Access the run report in the Torrent Suite™ Software using the Data tab.
|
Number |
Metric |
Description |
|---|---|---|
|
1 |
The number of filtered and trimmed base pairs reported in the output BAM file. |
|
|
2 |
The average signal for all library ISPs with library key (TCAG). |
|
|
3 |
The percentage of chip wells that contain an Ion Sphere Particle (ISP). The percentage value considers only addressable wells. |
|
|
4 |
A visual representation of well loading distribution on the chip surface. Red color indicates areas of high loading and blue indicates areas of low loading. |
|
|
5 |
The total number of filtered and trimmed reads independent of length reported in the output BAM file. |
|
|
6 |
The percentage of library ISPs that pass the polyclonal, low quality, and primer-dimer filters. This percentage is calculated by dividing final library ISPs by library ISPs. |
|
|
7 |
The percentage of chip wells that contain an ISP. The percentage value considers addressable wells. |
|
|
8 |
The predicted number of live ISPs that have a key signal identical to the library key signal or test fragment (TF) key signal. The Percent Enrichment value reported is the number of loaded wells with live ISPs that are Library ISPs or TF ISPs. This number is calculated by dividing wells with live ISPs by the number of wells loaded with ISPs. |
|
|
9 |
The percentage of clonal ISPs (all library and TF ISPs that are clonal, not polyclonal). An ISP is clonal if all of its DNA fragments are cloned from a single original template. All the fragments on such an ISP are identical and they respond in unison as each nucleotide is flowed in turn across the chip. This percentage is calculated by dividing the number of ISPs with a single DNA template by the number of live wells. |
|
|
10 |
The percentage of reads, which pass all filters, and which are recorded in the output BAM file. This value can be different from the Total Reads due to technicalities associated with read trimming beyond a minimal requirement that results in Total Reads being slightly less than Final Library. |
|
|
11 |
The average length, in base pairs, of called reads. |
|
|
12 |
The median length, in base pairs, of called reads. |
|
|
13 |
The mode length, in base pairs, of called reads. |
|
|
14 |
The read length histogram is a histogram of the trimmed lengths of all reads present in the output files. |