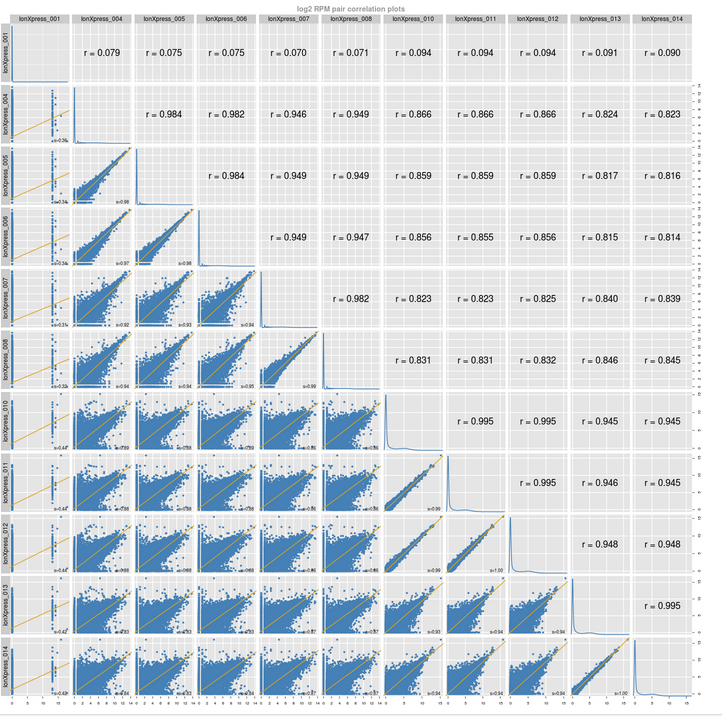
Correlation plot
The correlation plot is a barcode read pair correlation plot. Lower panels show log2(RPM+1) values plotted for each pair of barcodes, with linear least squares regression line overlaid and line slope reported. Upper panels show Pearson correlation r-values for the regression line. Diagonal panels show the frequency density plot for the individual log(RPM+1) values for each barcode. (If only one barcode has reads, a density plot is displayed.)
Click the plot to open an expanded view in a new window.