Distribution plots
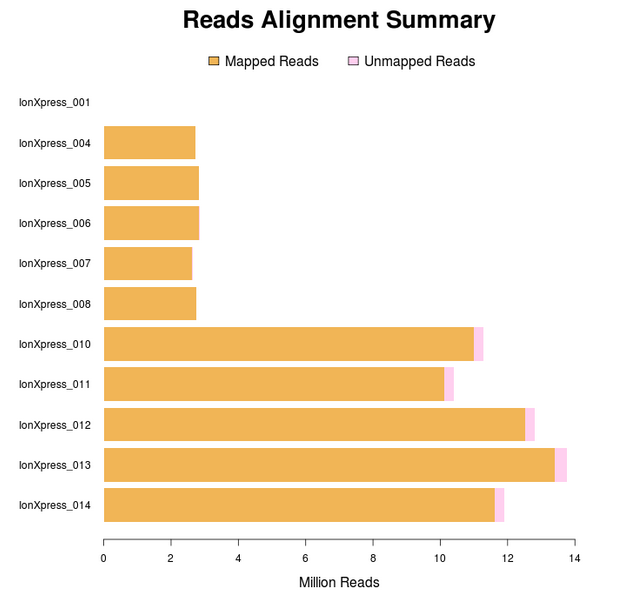
Reads Alignment Summary—A graphical summary of the number of mapped and unmapped reads across barcodes, as reported in the barcode summary table.
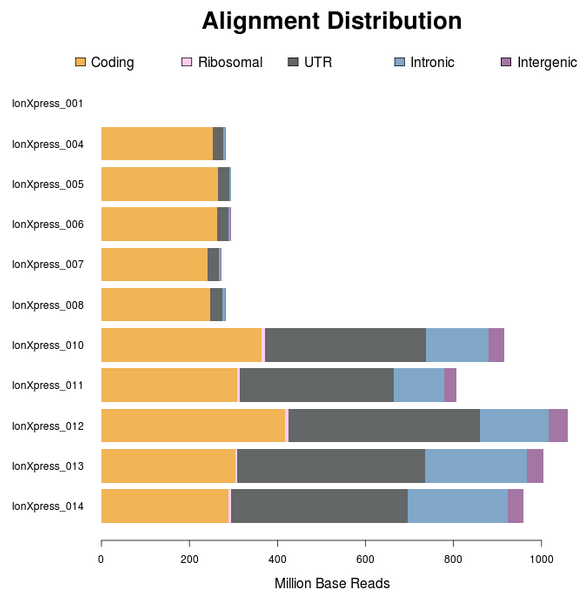
Alignment Distribution—A graphical summary of the distribution of reads to genomic features.
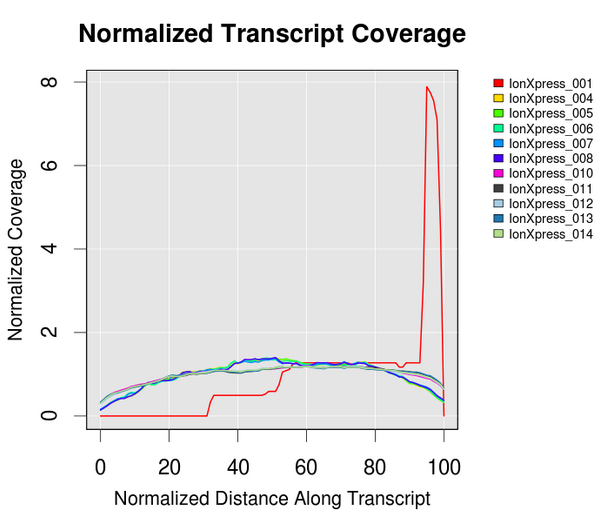
Normalized Transcript Coverage—An overlay of individual normalized transcript coverage plots for each barcode.
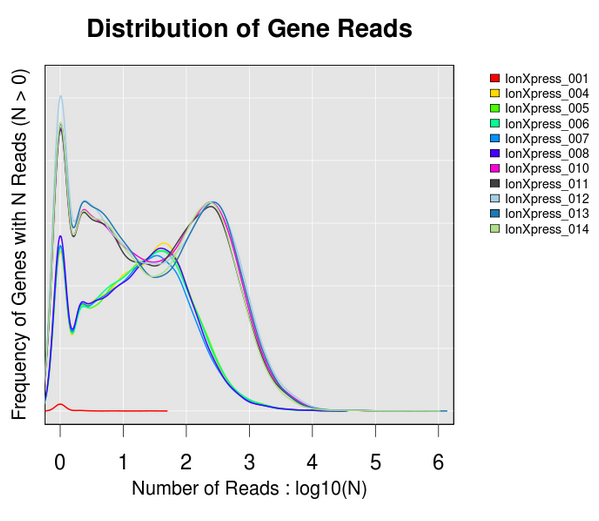
Distribution of Gene Reads—Distribution of genes across barcodes showing the frequency of numbers of genes having similar log10 read counts. All curves are plotted on the same axis scale. The counts data are fitted to a Gaussian kernel using the default R 'density' function.
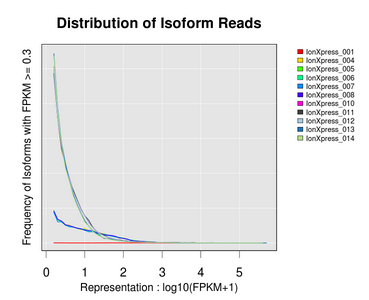
Distribution of Isoform Reads—Distribution of transcript isoforms across barcodes showing the counts of isoforms having similar FPKM values. All curves are plotted on the same y-axis, normalized to the highest count, and scaled for FPKM values ≥0.3.