Individual barcode view
Click any barcode of interest in the RNASeqAnalysis Report to see graphs for the selected barcode.
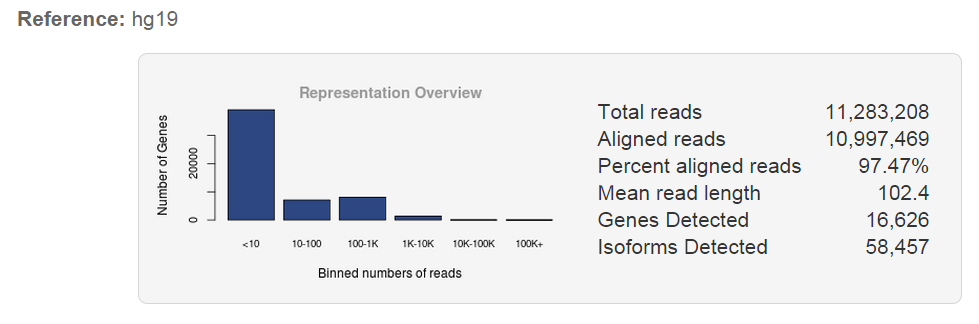
Reference table—A plot showing the number of genes with reads in log10 counting bins.
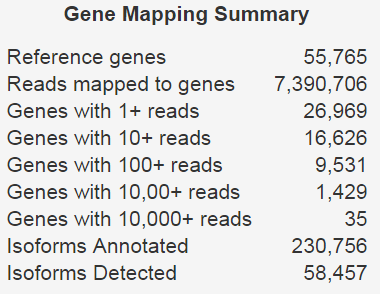
Gene Mapping Summary—A summary of reads mapped to genes of annotated reference.
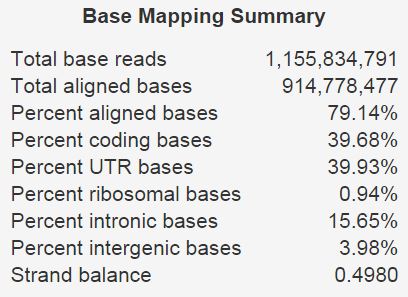
Base Mapping Summary—A summary of base reads aligned to genetic features of an annotated reference.
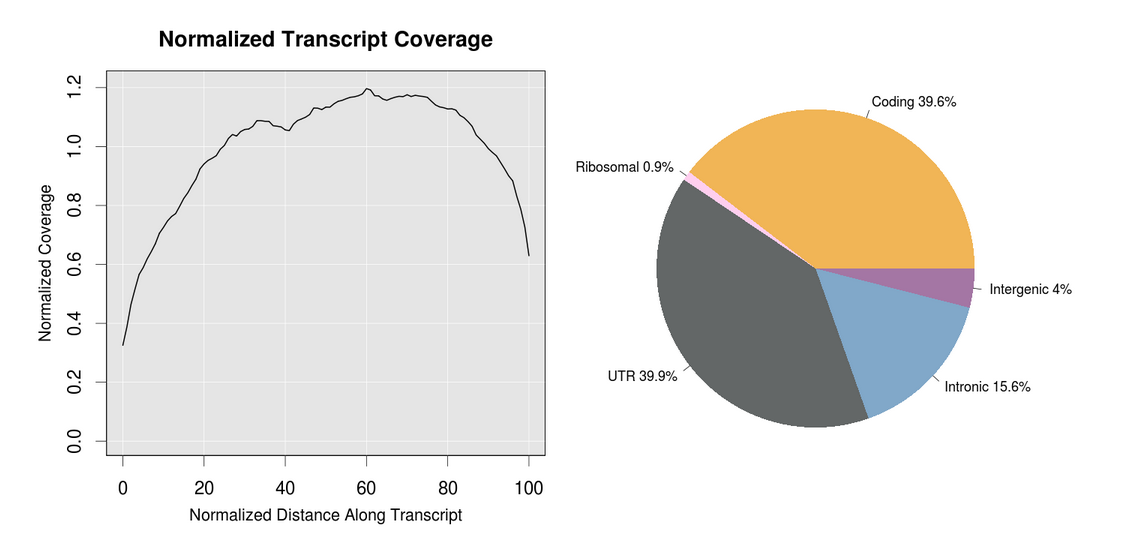
Transcript Coverage—A plot of normalized transcript coverage the frequency of base reads the length of individual transcripts they are aligned to in the 3' to 5' .
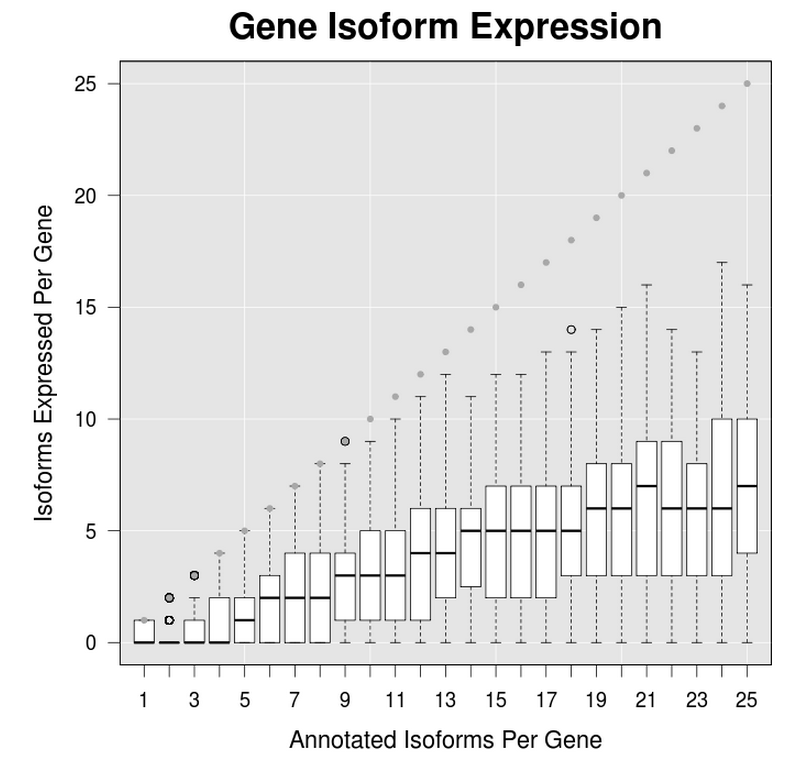
Isoform Expression— plots showing the variation of isoforms that are expressed at FPKM ≥ 0.3 for each set of genes that are grouped by the number of anticipated (annotated) . Whiskers points Q1-1.5xIQR to Q3+1.5xIQR. Only genes with 25 or less isoforms are represented in this plot. The data and a plot for all genes are available for download using the download reports links at the bottom of the screen.